Hello there ![]()
The issue is the robot system slowing down after a while (runs of 30minutes), the TF data getting lost and sometime the robot being a bit crazy at startup (in which case for now my only solution is give up and wait the next day).
Running rosbot_bringup and the Lidar S2 launch on a Jetson Orin Nano.
using the ros2 humble version, no docker, all directly natively in the jetson. Using the 500G card provided with the Jetson. We run in schedutil (economy) at 15W (not to overload the battery). CPU temperature seems okay < 60’C .
Nav2 and SLAM are run on PC not to overload the robot.
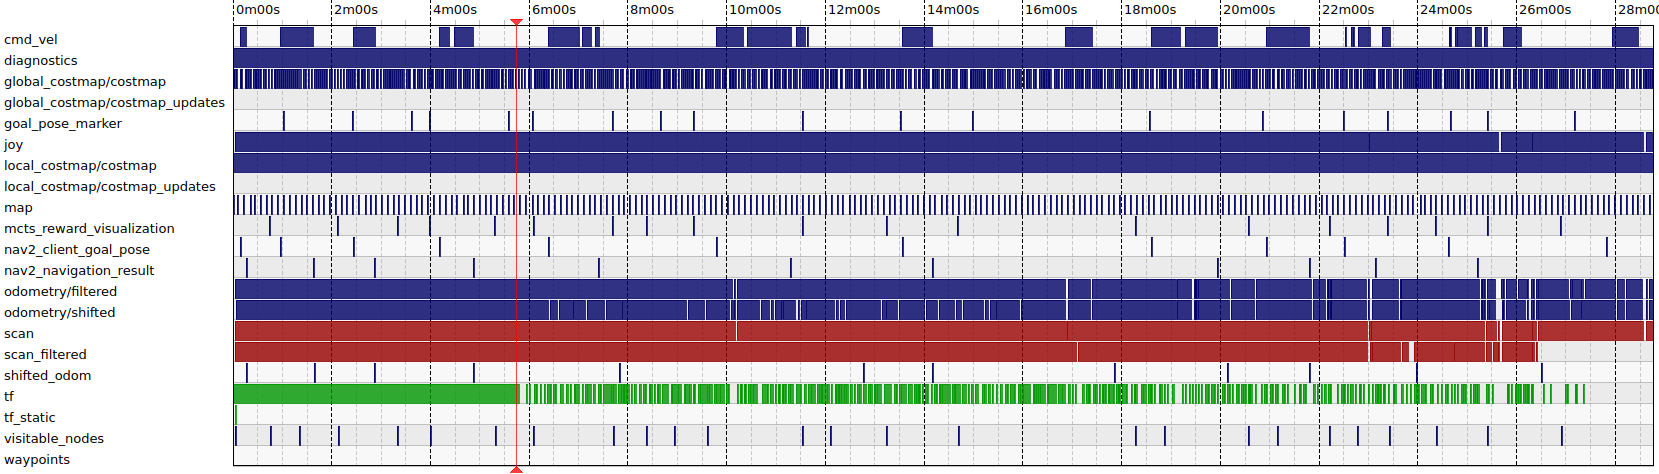
However, even like that, after about 30minutes of running, the robot’s reactivity to commands seems to slow down considerably (if we want to teleop it, it may not react, or react with delay), and we lose the TF publication and /scan_filtered (not /scan).
Recording via rosbag on the PC we can see the TF topic being sparser and sparser before being lost completely.
Sometimes we can see the LED telling us the state of the robot turning red for a second, I assume that corresponds with the /odometry/filtered message being lost from time to time (rare occasions)
I do not know if it is related, but sometimes when starting the robot at the beginning of the day, it will refuse to behave normally (When rotating, the IMU and odometry seem to perceive the rotation but the base_link TF stays fixed, resulting in the lidar data turning around in Rviz2 instead of the robot turning around and the lidar measurements staying fixed. When this happens, no turning back off and on solves it. It seems to happen after we fully charge the battery the previous day. (But causality or correlation… I personally do not believe it is linked). I found no solution in such cases, so giving up and returning the next day is my go-to then. It happens rarely, 1/15 of the days.
Here is a reading of the system; all seems okay despite the TF loss (here, the robot was idle, we killed everything running on the robot).
I’m probably missing to check something here, but I can’t find which tests I should do at this point. So I require your assistance to determine what to verify while running long runs. I am definitely missing something here.
Still probably unrelated information, but when we received the robot, we had to replace a cable at the get-go in the robot (The HDMI cable was defective, losing connection after a few seconds). Could the issue be hardware? Again, seems unlikely, but since we had an issue with the received robot, I mention it.
bash check_robot_health.sh ROBOT HEALTH CHECK Timestamp: Thu Dec 18 03:40:20 PM CET 2025 Hostname: rosbotxl
SYSTEM LOAD 15:40:20 up 1:42, 3 users, load average: 0.00, 0.01, 0.50
MEMORY USAGEtotal used free shared buff/cache available Mem: 7.4Gi 1.2Gi 2.6Gi 52Mi 3.6Gi 5.9Gi Swap: 3.7Gi 0B 3.7Gi ✓ Available memory: 6066MB
SWAP USAGESwapCached: 0 kB SwapTotal: 3901344 kB SwapFree: 3901344 kB ✓ Swap usage: 0%
DISK SPACEFilesystem Size Used Avail Use% Mounted on /dev/nvme0n1p1 468G 49G 400G 11% / tmpfs 3.8G 16M 3.8G 1% /dev/shm tmpfs 1.5G 35M 1.5G 3% /run tmpfs 5.0M 4.0K 5.0M 1% /run/lock /dev/nvme0n1p10 63M 110K 63M 1% /boot/efi tmpfs 762M 116K 762M 1% /run/user/1000✓ Root disk usage: 11%
CPU FREQUENCY (Throttling Check)Current frequency: 1497 MHz Max frequency: 1728 MHz
TOP MEMORY-CONSUMING PROCESSESUSER PID %CPU %MEM VSZ RSS TTY STAT START TIME COMMAND husarion 1968 0.2 2.7 3725216 212404 ? Ssl 13:58 0:13 /usr/bin/gnome-shell root 2146 0.1 1.3 512856 108892 ? Ssl 13:58 0:10 /usr/libexec/packagekitd husarion 2437 0.0 1.1 651956 88804 ? SNsl 13:58 0:02 /usr/libexec/tracker-miner-fs-3 husarion 2291 0.0 1.0 730176 84760 ? Sl 13:58 0:05 /usr/bin/gnome-software --gapplication-service root 1183 0.0 0.9 2188160 73360 ? Ssl 13:58 0:01 /usr/bin/dockerd -H fd:// --containerd=/run/containerd/containerd.sock
TOP CPU-CONSUMING PROCESSESUSER PID %CPU %MEM VSZ RSS TTY STAT START TIME COMMAND root 14 2.6 0.0 0 0 ? S 13:58 2:39 [ksoftirqd/0] root 20 0.3 0.0 0 0 ? S 13:58 0:19 [ksoftirqd/1] root 35 0.3 0.0 0 0 ? S 13:58 0:21 [ksoftirqd/4] root 40 0.3 0.0 0 0 ? S 13:58 0:20 [ksoftirqd/5] husarion 4168 0.3 0.1 22428 10244 ? S 14:03 0:19 sshd: husarion@notty
PROCESSES IN UNINTERRUPTIBLE SLEEP (D state)✓ No processes stuck in I/O wait
RECENT SYSTEM ERRORS (last 30 lines of dmesg)Not running as root - skipping dmesg (run with sudo for full diagnostics)
ROS PROCESSESFound 1 ROS-related processes: husarion 7741 0.1 0.7 911792 58192 pts/0 Sl 15:26 0:01 /usr/bin/python3 -c from ros2cli.daemon.daemonize import main; main() --name ros2-daemon --ros-domain-id 0 --rmw-implementation rmw_fastrtps_cpp